Finance
What are Indicators in Relation to Financial Markets and Trading?

Indicators are statistics used to measure current market conditions and to forecast economic trends. Typically, they fall into two categories: economic and technical indicators.
Economic indicators are economic information used to interpret and predict investment possibilities. They are also used many times to weigh the health of an economy. While they can be any set of economic data, most information relies on governments and organizations such as consumer price index (CPI), gross domestic product (GDP), employment levels, and prices of commodities (such as Oil).
All such economic indicators typically fall into three subcategories or groups: Leading, Coincident, and Lagging. Leading economic indicators are used to predict a market’s future movements as they naturally fluctuate before the actual market or economy does. Such indicators include yield curves, consumer durables, net business formations, and share prices. Coincident indicators offer real-time data as they move in tandem with specific economic activities. These metrics are most notably seen in an economy’s GDP, employment levels, and retail sales. Finally, Lagging indicators change following significant economic activity and shifts, including the gross national product (GNP), CPI, unemployment and interest rates.
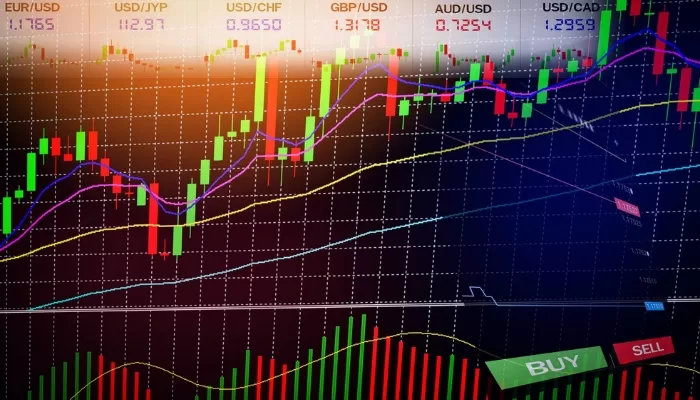
Opposingly, Technical indicators are mathematical calculations based on an asset’s or security’s price and/or volume. Common technical indicators include overlays, oscillators, moving average convergence-divergence (MACD) and relative strength index (RSI). More on this you can read at the LegacyFX Academy.
Overlays are indicators that use a similar measuring scale as prices yet are set above them on charts. Examples of this are Bollinger Bands. Oscillators titer between the minimum and maximum bands between extreme values, ultimately building a trend fluctuating between them. Examples include a stochastic oscillator, moving average convergence-divergence (MACD) and relative strength index (RSI). MACD relies on the assumption that the price of a traded asset will revert to a trend line. To determine such trend lines, traders look at a prices’ moving average over different periods. Opposingly, RSI compares the size of recent gains to recent losses to determine price momentum, either in an upward or downward capacity.
All these technical indicator tools help traders analyze price charts in an attempt to find distinguishable patterns that will indicate when to buy or sell. Learn more about the market in the LegacyFX Academy.


