Finance
Timeframes of Trading & Forex

Employing different or alternating timeframe strategies can assist in analyzing, spotting trends, and price actions of an asset. Therefore, it is crucial to have a solid understanding of trading time frames to utilize them properly. This article aims to portray the basic concept of time frames, their challenges, why they are helpful, and how they can be implemented.
The most common trading time frames are long-term, medium-term, and short-term. While most can incorporate all three, many choose to rely on one strategy or alternate when analyzing potential trades. Each timeframe has its benefits, with the long term being beneficial for identifying a trade setup versus the short term helping time entries.
| Timeframe Name | Time Frame |
| Long Term | Months – Years |
| Medium Term | Days – Weeks |
| Short Term | Hours – Days |
| Scalper | Seconds – Minutes |
Switching between different trading timeframes has advantages, especially when dealing with the forex market versus the stock market. The forex market allows for short views over a limited time in order to observe only the most meaningful information. Conversely, the stock market allows for longer views of information as new data may not present itself under short periods of time. Another proponent of switching between these various timeframes takes into consideration the 24-hour nature of the forex market. Switching between multiple forex time frames during different trading sessions (Asian, European, US) presents traders with different market conditions characteristic of a particular region.
It must be remembered that sometimes timeframes can provide misleading or conflicting information, which is why some traders stick to using only one timeframe. For example, an asset’s daily chart might show an up-trend, while an hourly chart would portray a down-trend.
Alternatively, some traders adopt a technique called Multiple Time Frame Analysis. This involves viewing the same currency pair under different time frames. With this approach, the larger time frame is typically used to establish a long-term trend, while a shorter time frame is used to spot ideal entry points.
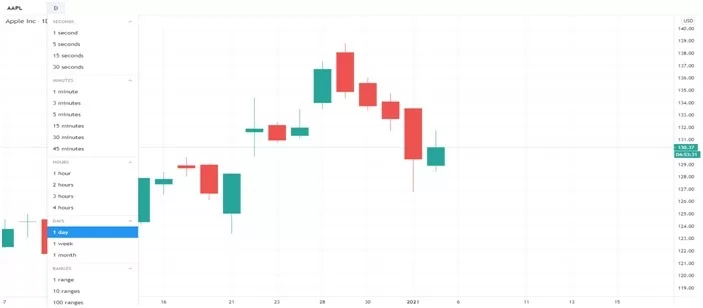
No matter which timeframe one chooses, the type of chart one finds can portray an assets’ movement over any period of time. This can range from seconds to hours as well as days or even years. As mentioned in another article, each chart’s bars, lines, candlesticks, or points represent a specific asset’s movement within a set period of time. In the example below, Apple Inc.’s (AAPL) performance is charted on a candlestick chart over a period of days. As such, each individual candle represents one whole day.

Overall, it’s important for traders to choose the best timeframe according to their preferred trading style and strategies they intend to use. This, along with the proper analysis chart, education, and sound risk management, will significantly improve one’s trading performance.


